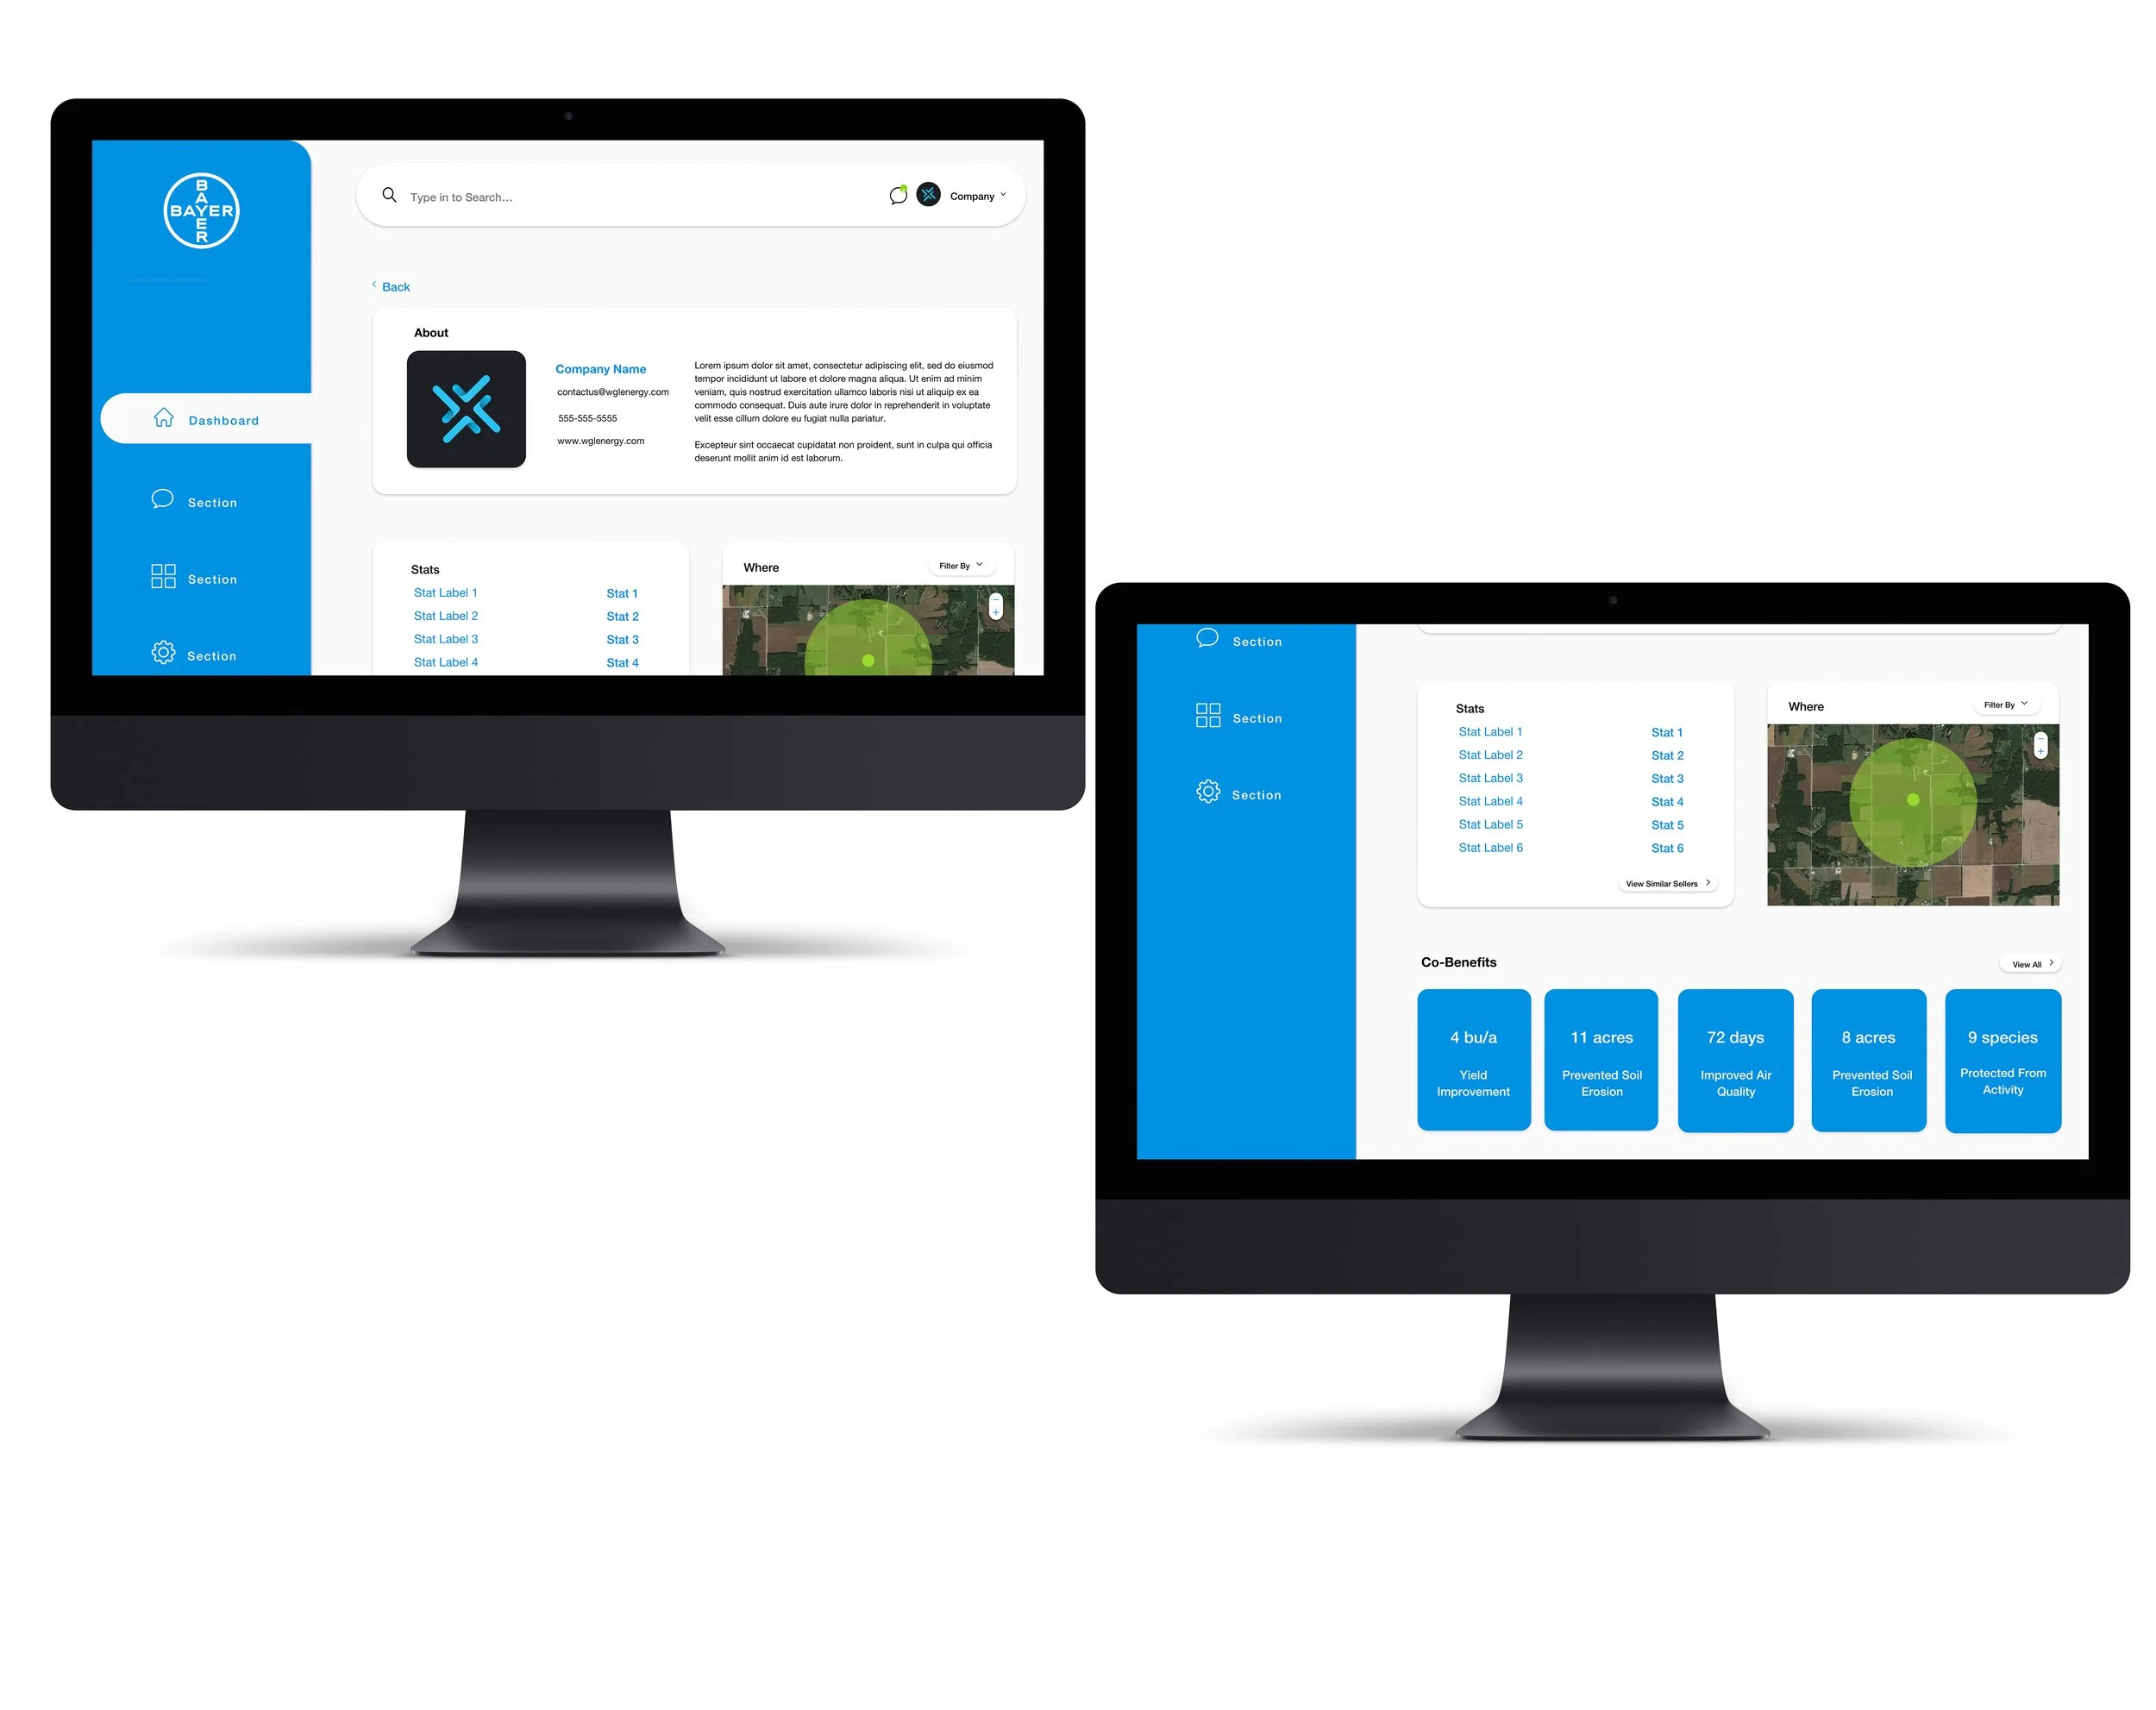
D A S H B O A R D U S E R I N T E R F A C E
Bayer Carbon Dashboard
PROJECT OVERVIEW
O V E R V I E W
The Solution
The successful enhancement of the Bayer Carbon Credit Portal will result in a more engaging and informative platform that better serves the needs of carbon credit buyers and sellers. By effectively communicating the value of carbon credits and their co-benefits, the portal will help drive greater adoption of sustainable practices and support Bayer's broader climate change mitigation goals.
The core challenge of this project is to enhance the Carbon Credit Portal to better serve the needs of both carbon buyers and sellers. Specifically, the portal must address the following:
Effective Communication of Co-Benefits: Carbon credits are often evaluated based on their additional benefits, such as improvements in soil health, water quality, yield increases, and wildfire reduction. The portal needs to effectively communicate these co-benefits to buyers, making the credits more attractive and justifiable.
Integration of Buyer and Seller Perspectives: Building on initial work, including interviews with potential carbon buyers and clickable prototypes for both buyers and sellers, the challenge is to seamlessly integrate these perspectives into a unified and user-friendly portal experience. This involves ensuring that both carbon buyers and sellers can navigate the portal efficiently and extract the information most relevant to their needs.
Enhanced Data Visualization and Storytelling: The portal should provide robust data visualization tools to help buyers understand their carbon portfolio and the impact of their investments. Additionally, it should facilitate storytelling that showcases the real-world benefits and success stories associated with their purchases.
User Experience Improvement: Based on feedback from initial prototypes, the challenge includes refining the user interface and experience to ensure that the portal is intuitive, engaging, and provides a clear value proposition for both buyers and sellers.
O V E R V I E W
About the project
In response to the escalating urgency of addressing carbon footprints, this project aims to develop a Carbon Buyer Portal specifically for Bayer customers. To bring more value to the buyers of these carbon credits, Bayer is developing a portal that will provide information on the respective buyer’s carbon portfolio and help the buyer tell the story of their investment. The communication of co-benefits is significant to enhance the value of the carbon credits, in that these are key buying criteria (soil health or yield improvements, increased water quality or wildfire reduction).
As companies and individuals alike face increasing pressure to mitigate their environmental impact, this portal is designed to facilitate transparency and track progress in reducing carbon footprints. The primary goal is to create a user-centric platform where buyers can access detailed information about their carbon reduction efforts and the stories behind their investments.
The primary users of the Carbon Buyer Portal will be Bayer's customers who are actively involved in carbon reduction efforts. This includes corporate clients, environmental managers, and sustainability officers seeking to monitor and enhance their carbon reduction strategies.
O V E R V I E W
The Challenge
O V E R V I E W
Tools used
For the development of the Bayer Carbon Credit Portal, I employed a suite of industry-standard tools to ensure a seamless design process from initial concepts to final implementation. InVision was used to create detailed wireframes in collaboration with the UX architect. Sketch was instrumental in developing both mid and high fidelity mockups. Adobe Photoshop was used to place the final designs into realistic device mockups. Zeplin was employed for the efficient handoff of design specifications to the development team.
WORK PROCESS
P R O C E S S
DISCOVERY
December
RESEARCH Competitor & User Journey
Project Timeline
DESIGN
January
UI Design Main flow & concept
CONTENT Copy
DELIVERY
February
INTERFACE Interactions & Final design
RESEARCH PROCESS
R E S E A R C H
Map and chart feature
Layout and user flow
Competitor analysis
In conducting a competitive analysis for the Bayer Carbon Portal dashboard, I examined a range of dashboards to refine the final design. My research highlighted several key features that would enhance usability and functionality. For instance, integrating an interactive pie graph emerged as a crucial element to dynamically display investment trends, allowing users to easily track increases or decreases. I observed that a user-friendly interface is paramount, ensuring accessibility and straightforward navigation. Additionally, the inclusion of an interactive map, which should be visually prominent, was consistently noted as a valuable feature in competitor dashboards. By evaluating these design elements and their implementation across various platforms, I gained valuable insights into creating an engaging and effective dashboard that balances visual appeal with intuitive user experience.
Side navigation and layout
Carbon footprint info dashboard
Side navigation and color palette
Gradient design element
INFORMATION ARCHITECTURE
I N F O R M A T I O N A R C H I T E C T U R E
Sketches
In collaboration with the UX architect, I developed initial sketches for the Bayer Carbon Dashboard, leveraging insights from competitor analysis and research on existing dashboards. The goal was to create a comprehensive and intuitive portal that effectively communicates the details of carbon credits and enhances the user experience for buyers. The initial sketches and design approach for the Bayer Carbon Dashboard lay the groundwork for a robust and user-friendly portal. By incorporating key features such as interactive maps, dynamic heat maps, detailed statistics, and customizable filters, the dashboard is poised to deliver valuable insights and enhance the overall user experience for carbon credit buyers. The global scope and inclusion of diverse data points ensure that the portal remains relevant and useful as the market evolves.
Navigation bar
Seller’s information
I N F O R M A T I O N A R C H I T E C T U R E
Total commitment
Co -benefits
Seller Profile
Seller Stats
Low Fidelity Wireframes
23%
Increase in carbon investments
46%
Increase in new customers
11%
Decrease in carbon footprint
DESIGN PROCESS
D E S I G N P R O C E S S
Color palette
#00314E
#3C91DC
#A5D54E
#E6E6E6
#FFFFFF
COMPLETED PROJECT
K E Y T A K E A W A Y S
Final Designs
In conclusion, this project has been an invaluable learning experience, particularly in balancing the need to reduce carbon footprints with effective and visually appealing design. The challenge of aligning the dashboard with client requirements while maintaining an attractive interface was significant, yet ultimately rewarding. The impact of these efforts is evident in the results: a 23% increase in carbon investments, a 46% rise in new profiles, and an 11% reduction in the carbon footprint from sellers. These metrics underscore the dashboard's effectiveness and highlight the success of integrating user-centric design with environmental goals. I invite you to review the final dashboard designs below to see how these achievements were brought to life.


